The IEEE-P2020 standard committee has been working for several years to define a measurement method for automotive cameras. It selected 7 image quality attributes to be characterized as follows.-
Dynamic Range
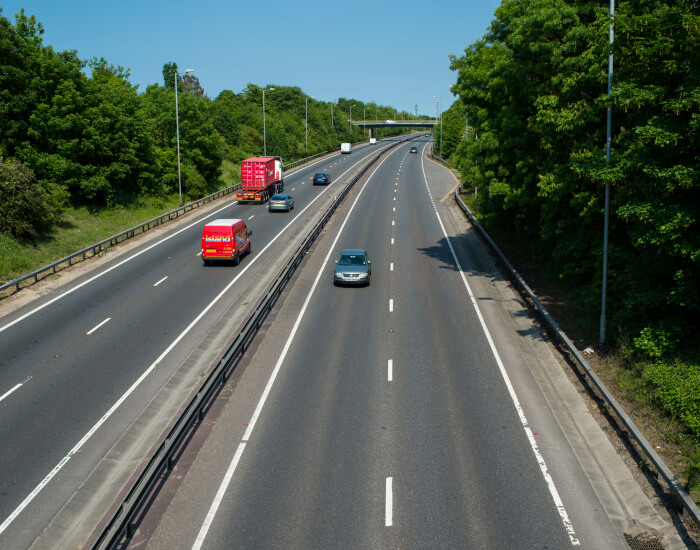
Example high dynamic range image
Example high dynamic range test chart
Image courtesy DXOMARK
Example high dynamic range test results
Image courtesy DXOMARK
Dynamic range refers to the ability of a camera to capture a wide range of scene luminance or radiance with accuracy and quality. In the context of automotive cameras, a high dynamic range is crucial for ensuring safety by providing clear and reliable images for various purposes, such as safety notifications and autonomous driving functionalities.
Since driving conditions can change rapidly, it is essential that the camera system can accurately interpret image details to minimize the risk of collisions. If a camera fails to capture the full dynamic range of a scene, important information may be lost, leading to misinterpretation and potentially dangerous situations for drivers, passengers, and pedestrians.
To evaluate the dynamic range capabilities of automotive camera systems, standardized black-box tests are conducted. These tests provide a systematic approach to measuring the dynamic range and characterizing any nonlinear processes employed by the cameras to extend their dynamic range. By following these testing procedures, manufacturers and researchers can assess the camera’s ability to capture a wide range of luminance or radiance values accurately.
Dynamic range is typically expressed as a ratio between the maximum and minimum scene luminance or radiance, often measured in decibels (dB). A higher dynamic range value indicates that the camera can capture a wider range of brightness levels, thus ensuring more accurate scene interpretation and enhancing safety in autonomous driving applications.
A video of the HDR camera measurements can be seen here.
Flare
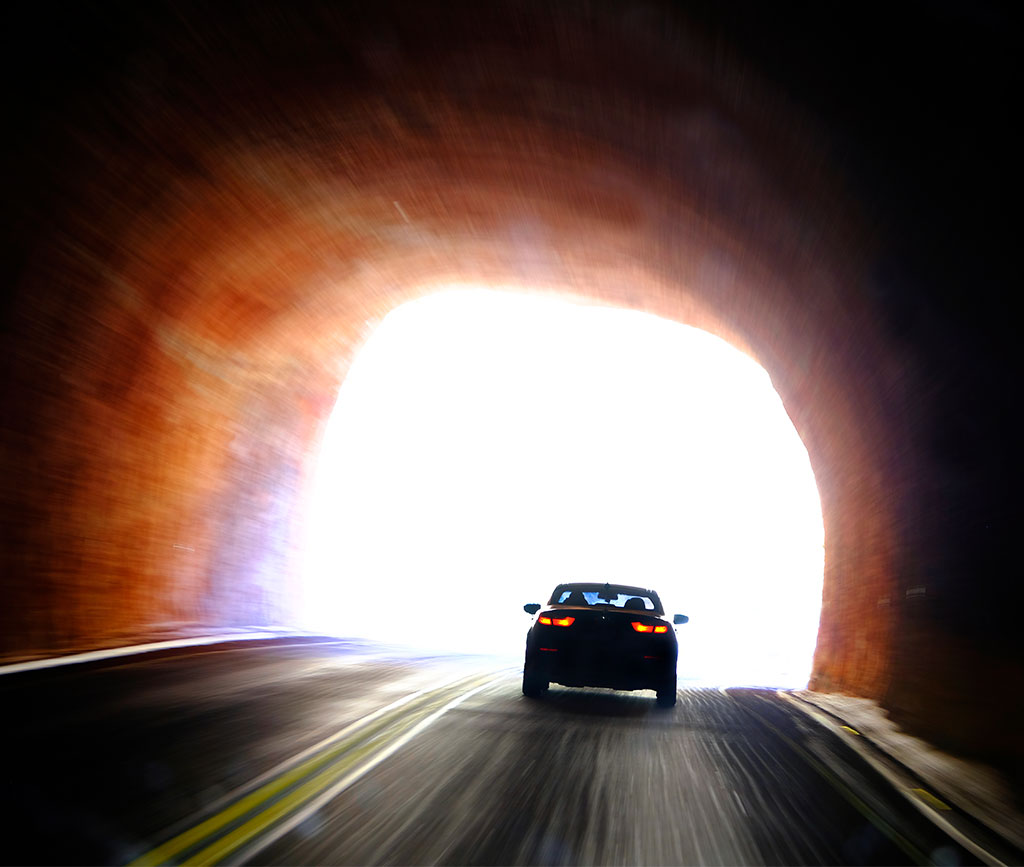
Example natural scene picture with flare
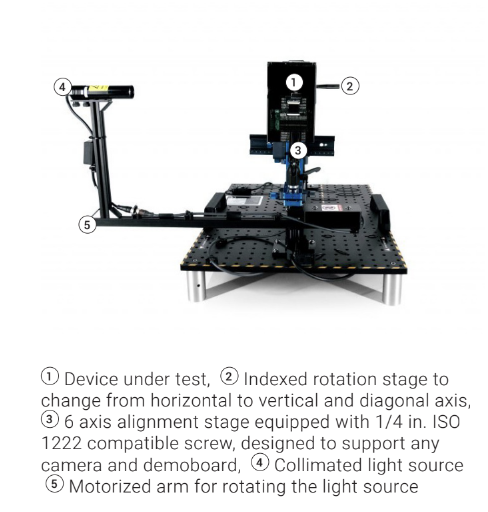
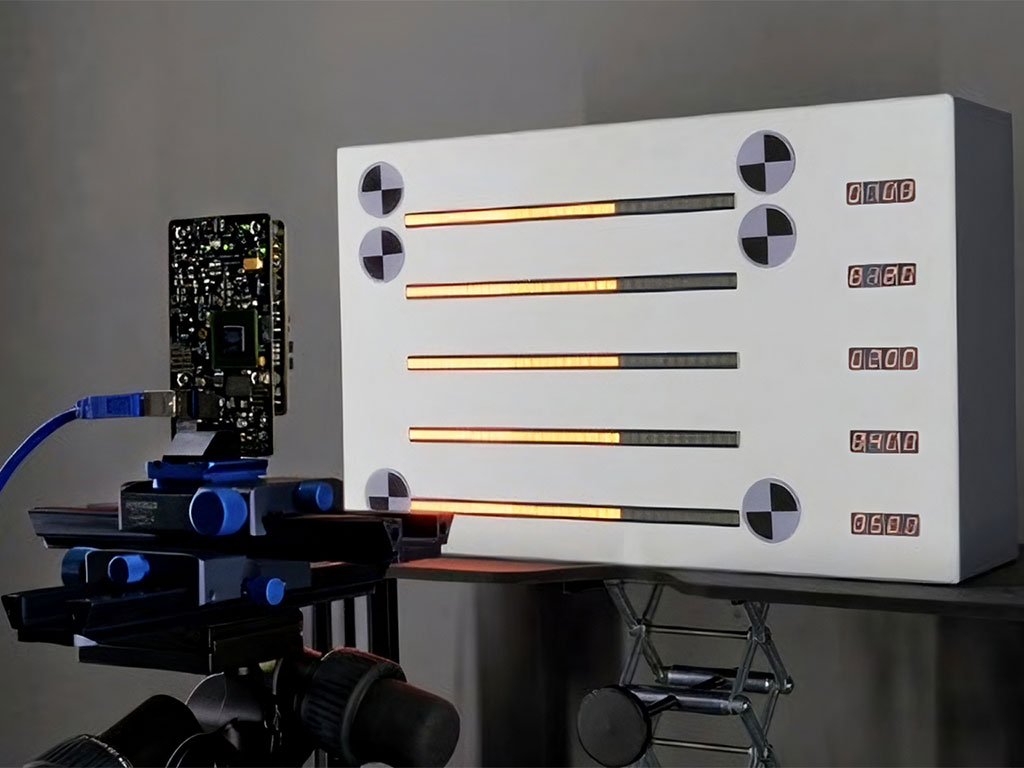
Flare test setup
Image courtesy DXOMARK
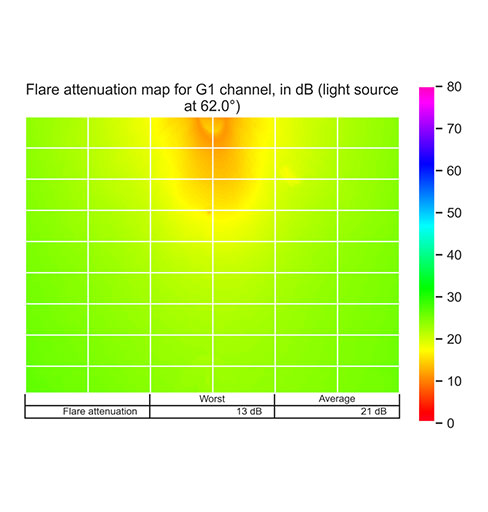
Example flare test results
Image courtesy DXOMARK
Example flare test results
Image courtesy DXOMARK
When an imaging system captures light, it not only captures the intentional light from the scene but also light from other sources and directions. This additional light is often referred to as “flare” or “stray light.” Flare can cause several issues in the resulting image, including a reduction in contrast, the appearance of unwanted artifacts, and a decrease in overall image quality. Flare is primarily caused by internal reflections and scattering within the optical elements of the imaging system. These reflections and scattering can occur between lens elements, on lens surfaces, or even within the camera body itself. When stray light reaches the image sensor, it adds to the overall signal captured by the sensor, resulting in a degradation of image quality. The impact of flare on an image depends on various factors such as the intensity and direction of the stray light, the design and quality of the lens, and the characteristics of the scene being captured. Lens coatings and anti-reflective measures are often employed to minimize flare by reducing internal reflections and improving the transmission of intended light. Photographers and cinematographers may use lens hoods or shades to block unwanted light from entering the lens and causing flare. Additionally, post-processing techniques can be applied to mitigate the effects of flare, such as adjusting contrast, removing artifacts, or using specialized software tools designed to reduce or eliminate flare.When an imaging system captures light, it not only captures the intentional light from the scene but also light from other sources and directions. This additional light is often referred to as “flare” or “stray light.” Flare can cause several issues in the resulting image, including a reduction in contrast, the appearance of unwanted artifacts, and a decrease in overall image quality. Flare is primarily caused by internal reflections and scattering within the optical elements of the imaging system. These reflections and scattering can occur between lens elements, on lens surfaces, or even within the camera body itself. When stray light reaches the image sensor, it adds to the overall signal captured by the sensor, resulting in a degradation of image quality. The impact of flare on an image depends on various factors such as the intensity and direction of the stray light, the design and quality of the lens, and the characteristics of the scene being captured. Lens coatings and anti-reflective measures are often employed to minimize flare by reducing internal reflections and improving the transmission of intended light. Photographers and cinematographers may use lens hoods or shades to block unwanted light from entering the lens and causing flare. Additionally, post-processing techniques can be applied to mitigate the effects of flare, such as adjusting contrast, removing artifacts, or using specialized software tools designed to reduce or eliminate flare.
Flicker
Flicker makes capturing traffic light more challenging
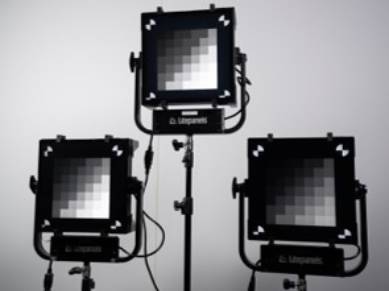
Flicker test setup
Image courtesy DXOMARK
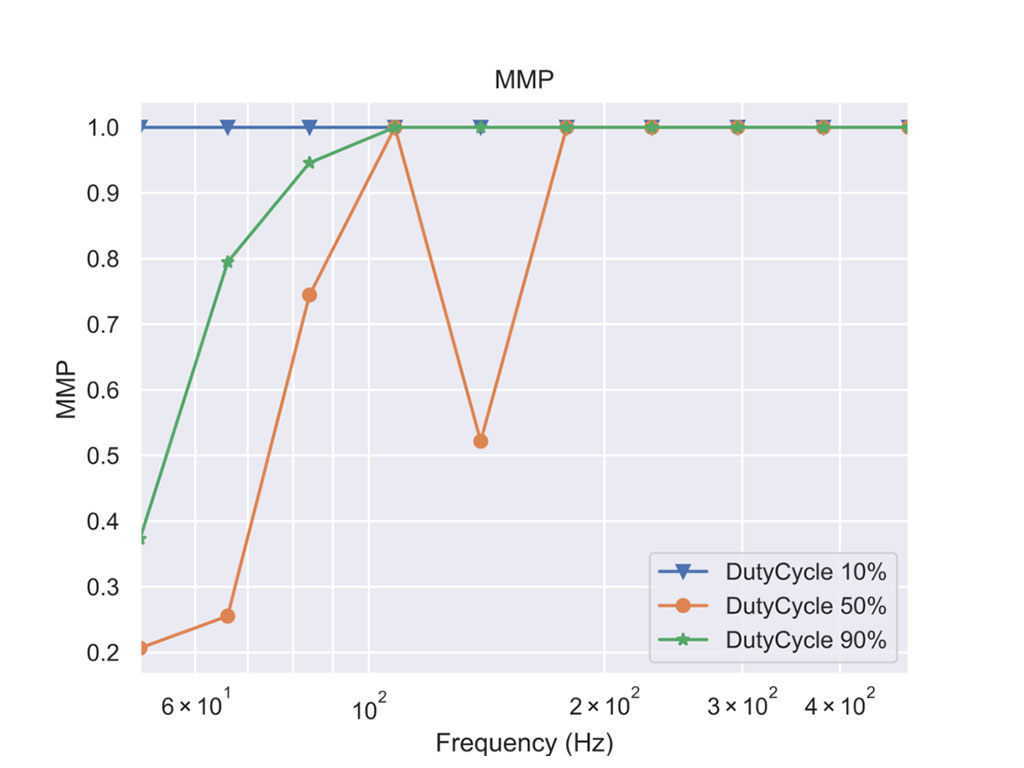
Flicker results
Image courtesy DXOMARK
Flicker, in the context of imaging, refers to the fluctuation in the brightness or color of an image caused by variations in the scene illumination. One common cause of flicker is the use of light sources powered by 50/60Hz alternating current (AC). Although the illumination may appear constant to the human eye, the brightness of a camera image or sequence of images may fluctuate if appropriate countermeasures are not taken.
The emergence of pulse-width modulation (PWM) driven LED lighting and advancements in automotive imaging have contributed to the growing occurrence of flicker from LED light sources as observed by video cameras. PWM is a technique used to control the brightness of LED lights by rapidly turning them on and off. However, when the camera’s exposure time synchronizes with the LED’s on-off cycle, it can result in flickering effects in the captured video or image sequence.
LED lights powered by PWM can introduce flicker in camera footage due to the mismatch between the camera’s frame rate and the LED’s on-off cycle. This phenomenon has become increasingly prevalent as LED lighting has gained popularity and is commonly used in various applications, including automotive lighting.
To mitigate the flicker issue, different approaches can be employed. Some cameras are equipped with anti-flicker technologies that adjust their exposure timing to minimize or eliminate the flickering effects. Additionally, specialized algorithms can be employed during image processing to reduce flicker in post-production.
Spatial Frequency Response
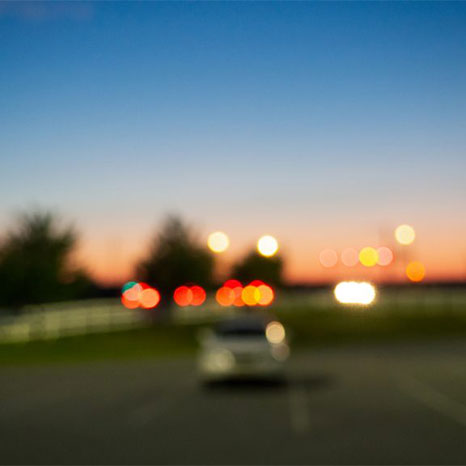
Blurry image on the road
Example SFR test charts
Image courtesy DXOMARK
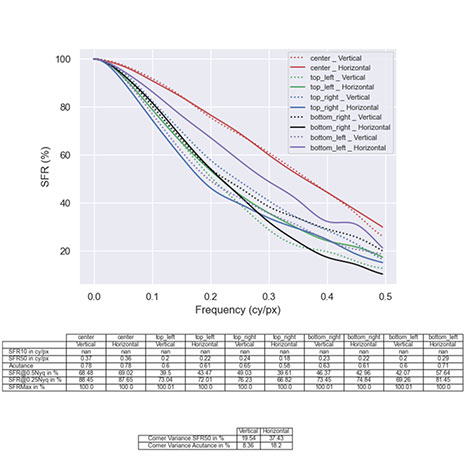
Example MTF test results
Image courtesy DXOMARK
The SFR (Spatial Frequency Response) of a camera system refers to its ability to capture and transfer spatial details from a scene to the camera output. It is a measure of the system’s resolution and is commonly used in the imaging industry to assess the performance of cameras. One common metric used to represent SFR is MTF50 (Modulation Transfer Function at 50% contrast). MTF measures the camera system’s ability to reproduce sharp and accurate details, and MTF50 specifically represents the spatial frequency at which the contrast drops to 50%. A higher MTF50 value indicates better resolution and sharper images.
Noise
Noisy Image
Example Noise Chart
Image courtesy DXOMARK
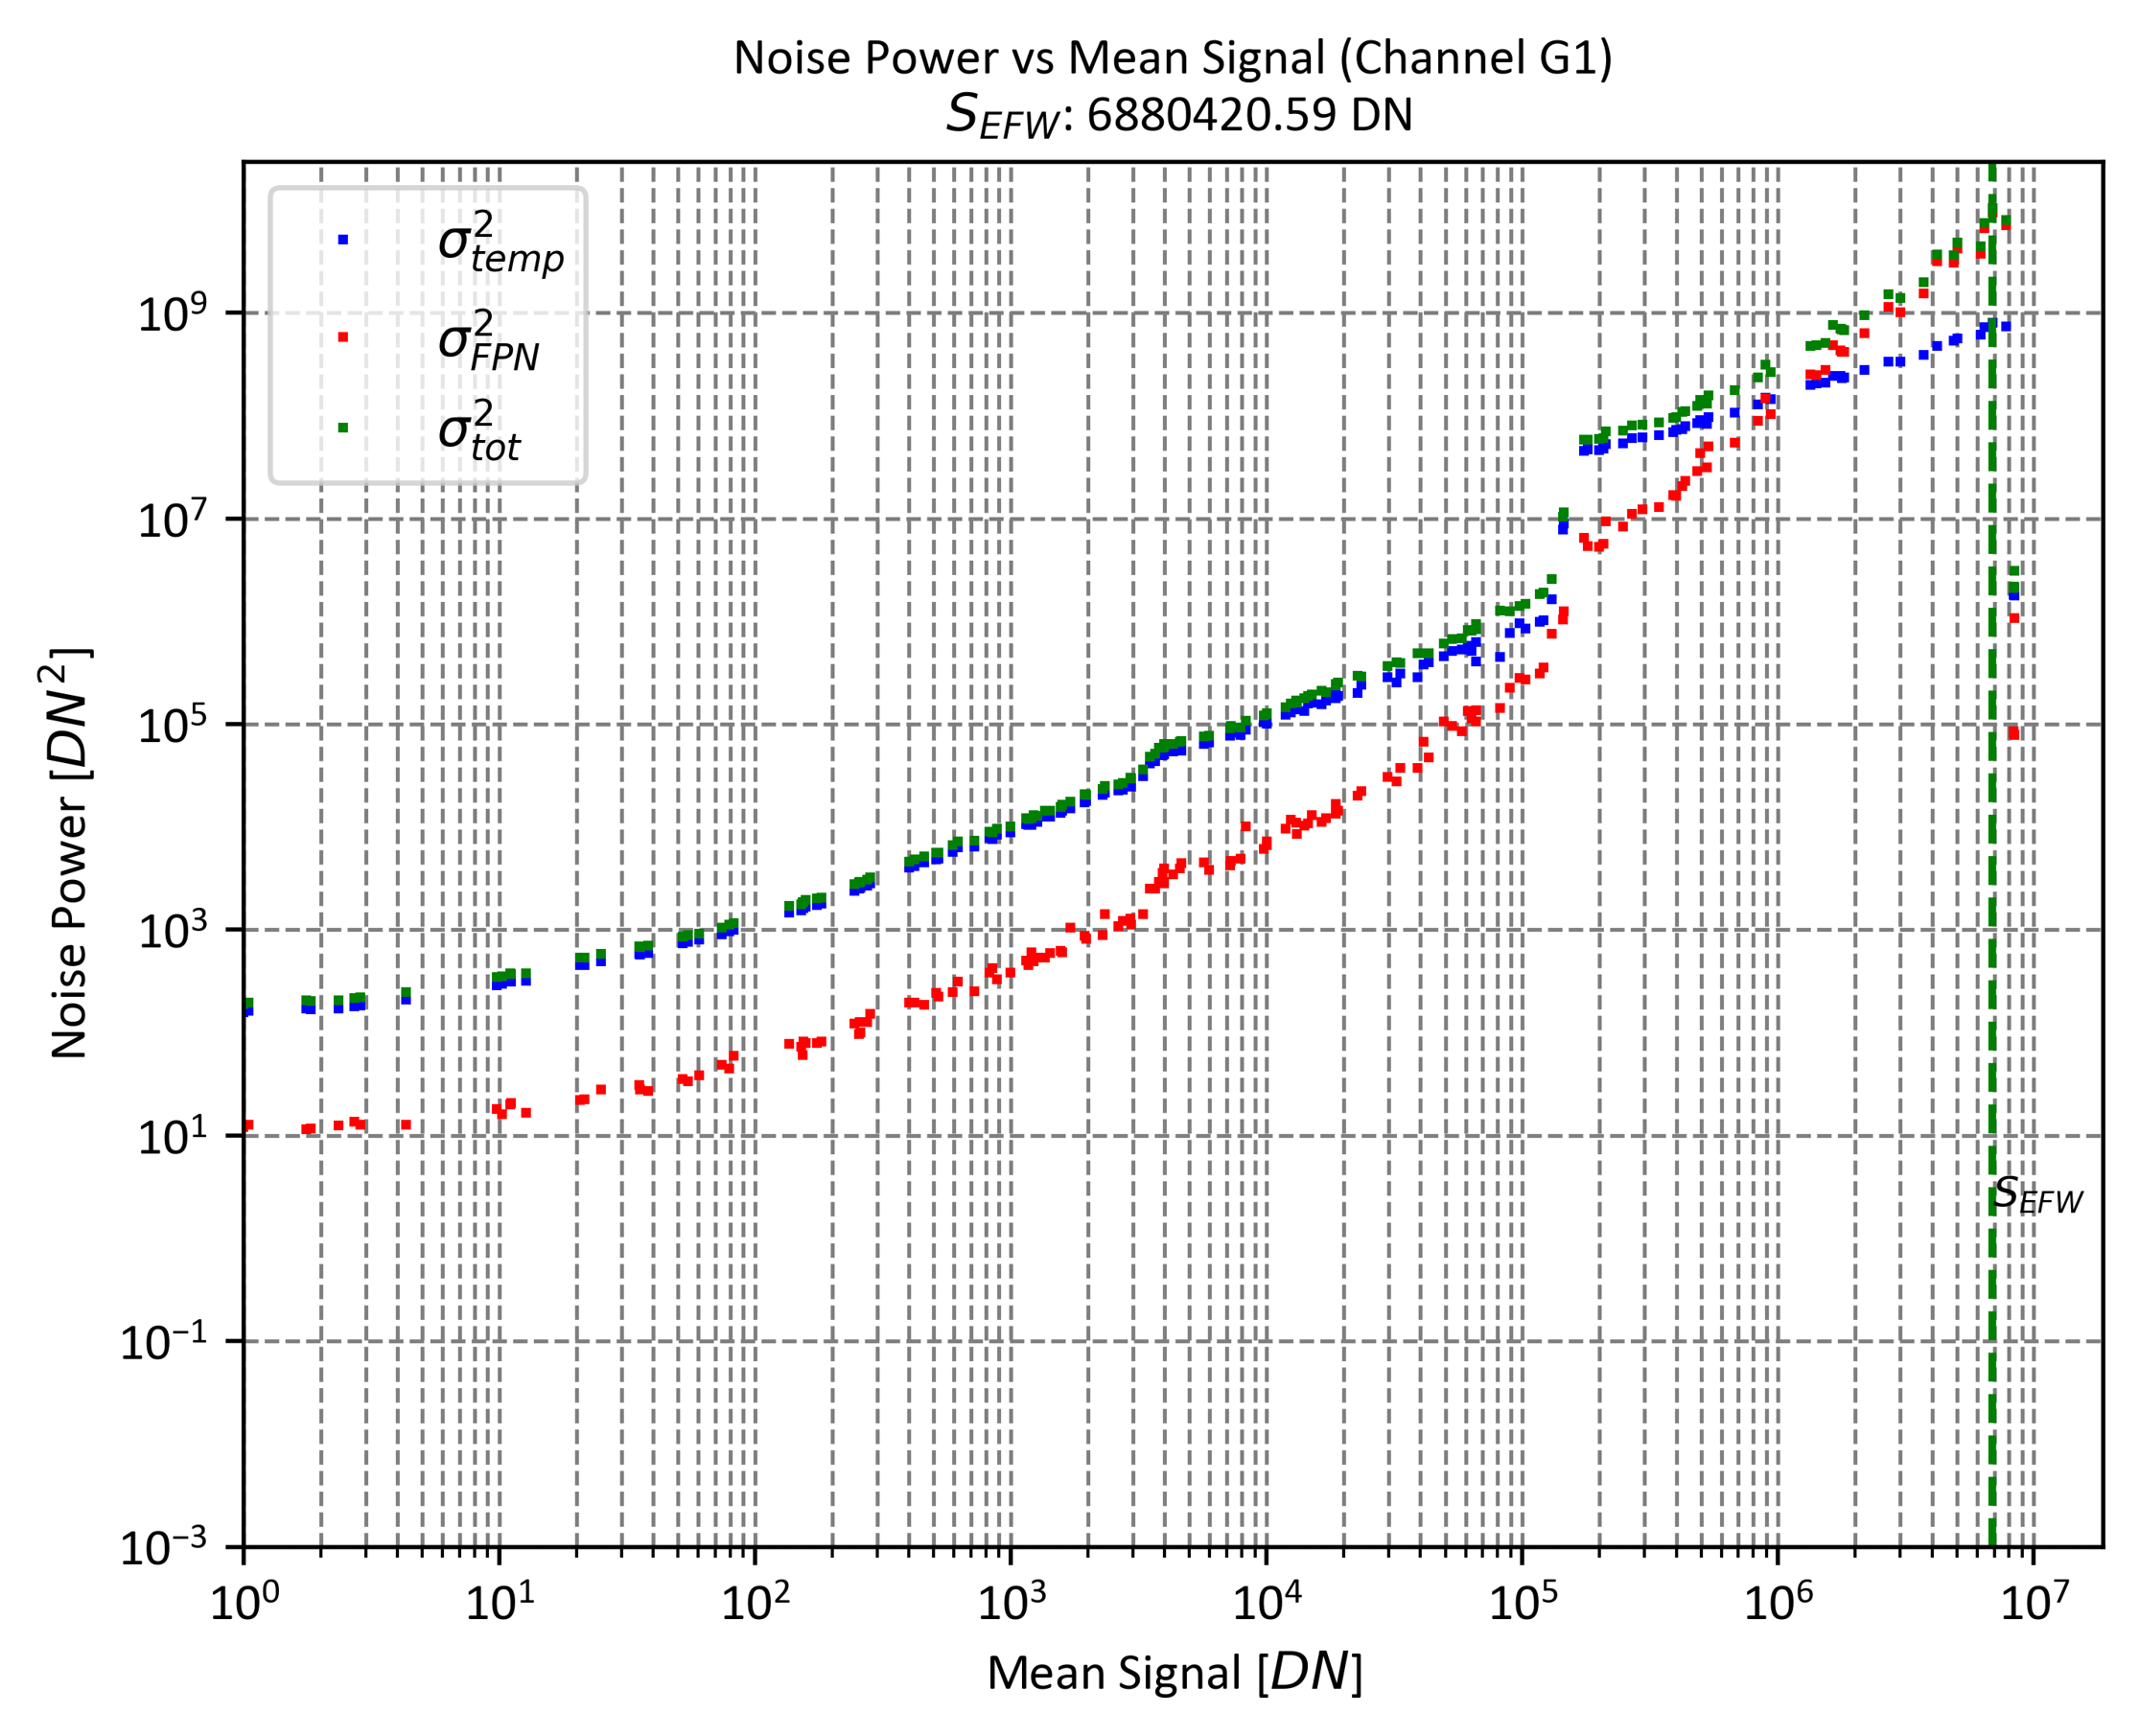
Example Noise Test Results
Image courtesy DXOMARK
In electronic imaging systems, noise refers to undesirable variations or fluctuations in the digital output of the system. Temporal noise specifically represents the pixel signal fluctuations that occur over time or from one frame to another, even under constant illumination. This type of noise is a combination of various sources, including noise from the sensor circuitry, statistical fluctuations in the dark signal, and fluctuations in the signal generated by the detected light. Fixed-pattern noise (FPN), on the other hand, refers to variations in the mean pixel signal across a uniformly illuminated pixel region in the imaging sensor array. Unlike temporal noise, FPN does not vary from frame to frame.
The presence of noise in electronic imaging systems can significantly degrade image quality in viewing applications. It can introduce unwanted artifacts, reduce clarity, and affect the accuracy of image analysis and processing algorithms. For example, in machine vision (MV) systems, noise can misguide object detection and identification algorithms, leading to potential errors or inaccuracies.
To evaluate the performance of an imaging system and assess the impact of noise, several metrics are used. Two commonly calculated metrics are the Photon Transfer Curve (PTC) and the Signal-to-Noise Ratio (SNR).
The Photon Transfer Curve is a plot that represents the relationship between the signal level (typically measured in digital numbers or analog-to-digital converter units) and the corresponding noise level. It helps characterize the noise behavior of the system and can provide insights into the system’s dynamic range, linearity, and overall noise performance.
The Signal-to-Noise Ratio is a quantitative measure that compares the level of desired signal (such as the pixel signal representing the image) to the level of noise present in the system. It is typically expressed as a ratio or in decibels (dB). Higher SNR values indicate a stronger, cleaner signal relative to the noise, which is desirable for high-quality imaging.
By analyzing the PTC and SNR, researchers and engineers can better understand the noise characteristics of an electronic imaging system, identify potential issues, and make informed decisions to improve image quality and optimize system performance.
Please see an example of Noise and SNR measurements here.
Geometric Calibration Validation
Lane tracking is one of the key feature of ADAS
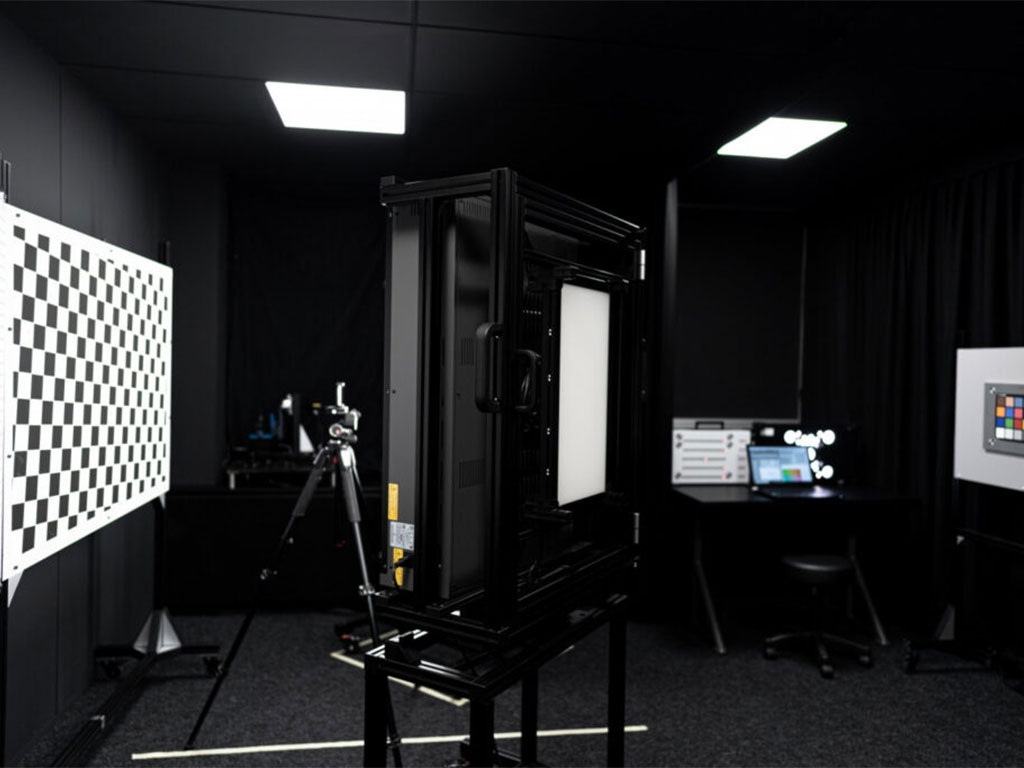
Example geometric calibration setup
Image courtesy DXOMARK
Geometric calibration validation for automotive cameras involves verifying the accuracy and precision of the camera’s intrinsic and extrinsic parameters. These parameters define the camera’s internal characteristics (such as focal length, lens distortion, and principal point) and its position and orientation in the vehicle.
CameraLab.ai is still working on offering a test setup geometric calibration validation.
Contrast
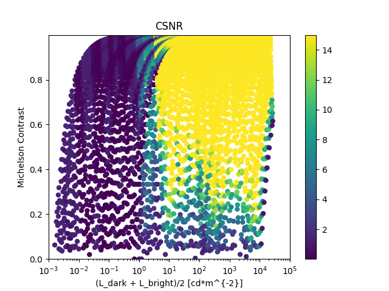
CNSR results
CPI charts
Contrast to Noise ratio evaluates the visibility or distinguishability of two objects of interest within an image against the background noise level. It takes into account not only the signal strength (contrast) between the objects but also the noise level in the image. A higher CNR indicates better distinguishability between the objects, making them more easily identifiable against the noise.
DXOMARK partnership
CameraLab.ai is partnering with DXOMARK to provide the testing methodology and equipment for the Fremont, CA lab. The lab is hosted in the offices of Leopard Imaging. Regular lab demonstration will be conducted for local customers. The lab can also be rented on an hourly basis.
CameraLab.ai is partnering with DXOMARK to provide the testing methodology and equipment for the Fremont, CA lab. The lab is hosted in the offices of Leopard Imaging. Regular lab demonstration will be conducted for local customers. The lab can also be rented on an hourly basis.


 DOWNLOAD DXOMARK AUTOMOTIVE IMAGE SENSOR EVALUATION REPORT